- Research article
- Open access
- Published:
The mathematics of tanning
BMC Systems Biology volume 3, Article number: 60 (2009)
Abstract
Background
The pigment melanin is produced by specialized cells, called melanocytes. In healthy skin, melanocytes are sparsely spread among the other cell types in the basal layer of the epidermis. Sun tanning results from an UV-induced increase in the release of melanin to neighbouring keratinocytes, the major cell type component of the epidermis as well as redistribution of melanin among these cells. Here we provide a mathematical conceptualization of our current knowledge of the tanning response, in terms of a dynamic model. The resolution level of the model is tuned to available data, and its primary focus is to describe the tanning response following UV exposure.
Results
The model appears capable of accounting for available experimental data on the tanning response in different skin and photo types. It predicts that the thickness of the epidermal layer and how far the melanocyte dendrites grow out in the epidermal layers after UV exposure influence the tanning response substantially.
Conclusion
Despite the paucity of experimental validation data the model is constrained enough to serve as a foundation for the establishment of a theoretical-experimental research programme aimed at elucidating the more fine-grained regulatory anatomy underlying the tanning response.
Background
Around 1 million years ago, a tanning response evolved in our hominid ancestors in which the accumulation of melanin granules in skin cells provided physical protection against the DNA-damaging effects of sunlight [1]. Today the tanning response is exploited by millions of people each year for cosmetic reasons. Because of the increased risks for melanoma and squamous cell carcinoma following overexposure to sunlight [2], the molecular biology of the tanning response has been given substantial biomedical attention over the last decades from dermatologists and oncologists (reviewed by [3–6]), as well as from those seeking ways to achieve tanning independent of sunlight [7].
The biomedical importance of the tanning response, and the potential benefits associated with being able to induce the response in safe ways, call for the establishment of deep knowledge of the underlying regulatory anatomy. However, despite some promising progress in recent years our understanding of the tanning response as a complex process in a system dynamics context is still rather moderate.
It is a common experience that the regulatory anatomy of complex biological systems involving several actors and intricate feedback relationships can be very hard to understand in qualitative as well as quantitative terms without guidance from a mathematical conceptualization of the dynamics. Many conceive that mathematical models are of no use until enough data are available so that they can be made very detailed. However, the heuristic importance of simple models should not be underestimated, as they serve as very efficient interfaces between various disciplines and help us to assess whether our current conceptions of mechanisms, processes and interactions do really lead to the dynamic behaviours we observe.
Here we provide a simple first-generation mathematical model describing the dynamics of melanin content in epidermal layers when the skin is exposed to UV radiation. The main rationale for this effort is to provide a theoretical foundation of appropriate resolution to guide the establishment of a theoretical-experimental research programme aimed at resolving key issues concerning the regulatory anatomy of the tanning response. A conceptual model outlining the major premises underlying the mathematical model is given in Figure 1, and in the remaining part of this section we provide a biological backdrop and the basic premises underlying our current mathematical conceptualization of the tanning phenomenon.

Melanin production and distribution as response to UV radiation. Outline of the melanin unit. The melanin content of each layer is a function of melanin delivered from the melanocyte (green arrows), melanin degradation (red arrows) and the melanin in the cells moving upwards (blue arrows). The distributed melanin absorbs UV radiation (described by decreasing darkness of the arrows with increasing depth). Increase of the UV radiation reaching the basal layer triggers signal substance production. In turn, the signal substances stimulate melanogenesis and dendrite growth in the melanocyte (pink arrow).
The tanning response
The tanning response is the additional production and distribution of melanin, exceeding the constitutive level, following UV stimulation. The UV signal is transduced from the primary recipient to the melanocyte, where the photoprotective pigment melanin is produced and distributed. In addition to the optical shielding effects, melanin and its precursors and intermediates act as free-radical scavengers as well as signalling molecules [8–10]. The tanning response thus encompasses UV sensing, signal transduction, melanogenesis, melanosome mobilization and transfer to keratinocytes as well as the further distribution through the epidermis via keratinocyte migration.
Photobiology of the UV radiation
UV radiation is electromagnetic radiation with wavelengths just below visual light (100–400 nm). The biologically most relevant wavelength segments are UVA (320–400 nm) and UVB (290–320 nm). UVB represents the most bio-reactive part of the spectrum both as inducer of erythema and tanning. Our current conception is that UV radiation causes basal cell skin cancers, such as basal cell carcinoma and malignant melanoma, through its mutagenic effect on basal layer cells. Melanin has a remarkable capacity to absorb UV radiation and to reflect it at the shortest wavelengths (<300 nm) [11].
Signal transduction
UV radiation is the major inducer of the tanning response. Even though the identities of the primary UV-responsive agents are unknown, both keratinocytes and melanocytes produce various substances that enhance melanogenesis upon UV stimulation [6, 12, 13]. These comprise the elements controlling the activity of the hypothalamus-pituitary-adrenal axis which are expressed in the skin, including corticotropin releasing hormone (CRH), urocortin, and POMC, with its products ACTH, β- and γ-LPH, CLIP, α- and β-MSH, and β-endorphin [14–16]. The skin is therefore conceived to possess a complete stress handling system of which the tanning response is an important part [17]. The hormone αMSH and its receptor MC1R are important mediators of UV induced tanning [6, 18–20]. It has recently been proposed that the increased POMC transcription in keratinocytes following UV exposure is p53 dependent [21]. Even though the POMC derivatives do not seem to be crucial in constitutive melanin production in mouse [22, 23], genetic variants of their receptor, MC1R, are deemed to be the main determinant of constitutive melanin levels, and also of the tanning ability in humans [18, 24, 25]. This enigmatic situation substantiates the challenges involved in understanding the intercellular signalling network of the skin.
Melanogenesis
Melanogenesis, which occurs within discrete cytoplasmic organelles of the melanocyte called melanosomes, is a process where the amino acid tyrosine is converted into melanin pigment. Tyrosinase is regarded as the rate-limiting enzyme in this process. The transcriptional regulation and the posttranslational activation of tyrosinase are the key regulation points for the melanogenesis. Microphthalmia-associated transcription factor (MITF) is a central protein in the transcriptional regulation of tyrosinase and thereby melanogenesis, as demonstrated by its role in Waardenburg syndrome type 2 and Tietz syndrome [26]. The architecture of the MITF promoter region suggests that several transcription factors (like SOX10, PAX3, LEF1/TCF, CREB and ONECUT2) are involved in melanogenesis and the tanning response [3, 5, 27]. LEF1/TCF and CREB are responsible for the immensity of MITF promoter responsiveness to UV radiation via MC1R/cAMP/PKA and the WNT/β-Catenin pathways [3, 5, 28–30]. MITF is therefore proposed to act as a self-regulating switchboard for diverse pathways originating in the cell membrane or the intracellular environment and regulating the activity of the melanogenic apparatus [5]. Other transcription factors can also activate melanin production, like the ubiquitous basic helix-loop-helix-leucine zipper transcription factor USF1, which is reported to be essential for the tanning response, and indeed MITF and USF1 share binding site specificity [31].
Both p38, ERK1/2 and other MAP kinases are involved in MITF signalling and regulation [3, 5, 32]. The MAP kinase pathway is in turn activated by several ligands such as KITLG, FGF2 and EGF. The MAPK pathway may also activate CREB via RSK1, illustrating the complexity of the structure in these networks. The key second messenger cAMP appears to be another point of cross talk between the αMSH-MC1R pathway and the MAP kinase pathway [33]. See [3–5] for comprehensive reviews of the molecular biology of melanogenesis.
The melanin is delivered to nearby keratinocytes through dendrites
An additional effect of UV irradiation and the subsequent release of CRH, the POMC derivatives and even endothelins and nitric oxide is stimulation of melanocyte dendrite growth and melanosome delivery to keratinocytes [5, 20, 33–36]. Each melanocyte attached to the epidermal basement membrane exports mature melanosomes to nearby keratinocytes through its dendrites. The uptake of melanosomes by the keratinocytes is an active process involving regulatory processes in the dendrites as well as in the keratinocytes [8, 16, 37–39].
Further distribution through keratinocyte movement
95% of the cells in the epidermis are keratinocytes and a fraction of the keratinocytes in the basal layer is "stem" keratinocytes which produce new keratinocytes continuously through cell division. From being attached to the epidermal basement membrane initially, these "non-stem" keratinocytes move progressively toward the skin surface. In a cross section of the epidermis the keratinocytes form four distinguishable layers named stratum basale, stratum spinosum, stratum granulosum and stratum corneum [40]. The thicknesses of the viable parts of the epidermis (basale, spinosum, granulosum) and of stratum corneum vary between individuals and are correlated with a number of factors like age, body site, gender, UV-exposure, smoking habit, and physical tire [41].
Mathematical modelling of pigment distribution and production
The model aims to translate the available empirical knowledge into a dynamic model of pigment production and distribution in order to establish a theoretical foundation enabling a deeper and more quantitative understanding of the highly interesting and important tanning phenomenon. The model is described in detail in the Methods section, but here we state its most important premises. The model is designed to describe the dynamics associated with what is called a melanin unit, which consists of one melanocyte and the keratinocytes with which it maintains functional contact. In one melanin unit there are around 36 keratinocytes distributed between the three viable layers [40].
The model describes the melanin content M j in layer j, j ∈ {c, g, s, b} (layers are referred to by their initial letter), the signal substance concentration s and the dendrite length relative to the length from mid-melanocyte to stratum corneum, x. In the constitutive condition, i.e. in the absence of UV radiation, the melanin produced in the melanocyte is assumed delivered only to the basal layer. The melanin is then distributed outwards by the continuous movement of keratinocytes towards the skin surface. The constitutive level of melanin production and delivery is in equilibrium with the melanin degradation and the loss of melanin through keratinocytes shed from the skin surface. Exposure to UV radiation triggers signal substance production, which, in turn, leads to enhanced melanogenic activity. Due to the resolution level of our model, the complex signal processing is condensed into one signal concentration value s, which alters the ratio of the number of ligand bound receptors to the total number of receptors on the melanocyte membrane. While this is a severe simplification of a complex phenomenon, we are still able to capture the systemic behaviour on the current level of resolution. Dendrite growth and melanin production are both assumed to depend on this ratio. Consistent with how biological compounds are normally degraded and in accordance with common modelling practice, degradation of melanin and signal substance are assumed to be linear.
The dendritic growth following UV exposure may show a quite complex geometry, and in the model this growth process has been very much simplified. To derive the functions which describe how melanin is distributed into the epidermal layers, we assume a uniform growth process and that all keratinocytes that can be reached from one melanocyte with a dendrite of a given length will receive the same amount of melanin.
The available data
Even though a considerable amount of empirical data has been used as a basis for model construction, the amount of available relevant validation data is very modest. To the best of our knowledge, there is currently only one experimental study reported where human skin exposed to UV-exposure is subsequently biopsied to analyse the melanin content in the different epidermal layers [42, 43]. In this work, Tadokoro et al. exposed nine individuals to a single 1 minimal erythema dose (MED) of UVA/UVB radiation. Biopsies were taken before and seven days after the exposure. Using the Fontana-Masson method, they established the melanin content in the basal, spinosum and granulosum layers of epidermis on these two time points. These data points are reported as single measurements, i.e. no standard error or standard deviation are given. The amount of melanin is given in a not scaled unit and with no measurement of volume. The thicknesses of the different epidermal layers are varying a great deal and it is therefore difficult to establish good concentration measures from these data.
Results
Reproduction of empirical data
The model was parameterized to fit available data on the distribution of melanin in the different epidermal layers and how different skin types respond to UV radiation. Consistent with Tadokoro et al.'s [42] experiments, the model was exposed to a UV pulse. The eight free parameters of the model were optimized to fit nine different data sets representing nine different individuals (S5, S30, S21, S27, S47, S35, S37, S19, S26, using the denotation of Tadekoro et al.). For six of the individuals (S21, S47, S35, S37, S19, S26), the model successfully describes the observed melanin distributions and can be calibrated to mimic individual differences (Table 1 and Figure 2, lower panels). The model is not able to describe data corresponding to the three remaining individuals (S5, S30 and S27, see Discussion). Results for these individuals are therefore not shown in the table or the figure.

Temporal evolution of dendrite length and melanin levels in epidermal layers after a pulse of UV radiation. Each column corresponds to individuals whose melanin data can be described by our model. Top panels: Length of the dendrites relative to total layer thickness. The horizontal lines define the boundaries between the layers. The colour of the curve indicates which layer the tip of the dendrite extends to (blue; basal, green; spinosum, red; granulosum). Lower panels: Temporal evolution of the melanin level in each layer, blue stars indicate observed data. Both in the experiment and the model the UV-pulse was given immediately after the first measurement. In plots displaying melanin levels, scaling is omitted to highlight the fitting of the model to data.
Dendricity
After the UV pulse, the dendrites first grow and then retract (Figure 2, top panels). The dendrite extension into the layers of epidermis differs substantially between individuals both in length and duration. Individuals S47, S35 and S37 are described by the model with intermediate dendrite lengths lasting longer than the one week simulation time, while S21, S19 and S26 exhibit longer dendrites over a shorter period of time.
Identifiability
The primary object of the model fitting process is to demonstrate that the model is capable of describing the melanin dynamics in the individuals that constitute our dataset. However, in this context it is important to consider to which degree the actual parameters can be uniquely determined. Such determination may be prevented by the structure of the model equations as such (lack of structural identifiability) or, more generally, because the model structure and/or the scarcity or poor quality of the data make it impossible to obtain reliable parameter estimates (lack of practical identifiability) [44]. We examined the practical identifiability of the model by assessing parameter determinability in the six individuals which the model could explain. Using the criterion that a parameter is determinable if the absolute value of its cross-correlation with all other parameters is below 0.95, none of the individuals showed determinability in all parameters and no parameter was determinable in all individuals (Table 2). In fact, in individual S26, not a single parameter was deemed to be determinable (see Methods for further details and for information on parameter confidence intervals).
Sensitivity analysis
A sensitivity analysis of the model was performed in order to identify the robustness to variation in each parameter. The sensitivity was assayed by perturbing one parameter value at a time and then computing the goodness of fit for the resulting parameter set relative to the goodness-of-fit of the optimized parameter set as a function of degree of perturbation (Figure 3, left and middle columns). Generally, we observe that the model fit is substantially more sensitive to variation in the parameters fmin, γ s , ω g , ω b than in the parameters find, α, γ s , A (compare the left and middle columns of Figure 3, where the effect of perturbations in these two subsets are displayed, respectively). In addition, for each of the six individual cases we tested to what degree a modest simultaneous random perturbation of all parameters worsened the fit to the empirical data (Figure 3, right column). This exercise reveals that in some individuals (S21, S47, S35 and S26) the fit is substantially worsened with a relatively slight perturbation of the parameter values. These are the same individuals that have a very sharply defined optimum (see corresponding left and middle columns). In comparison, for individuals that have a widely defined optimum (e.g. S37 and S19), the goodness-of-fit is almost not affected by the small random perturbation (right column).

Sensitivity analysis. Sensitivity (goodness-of-fit with one perturbed parameter relative to the goodness-of-fit at the optimized parameter set) to variation in the value of one parameter at a time in the neighbourhood of the optimized parameter set, sorted in one high sensitivity group (fmin, γs, ωs, ωb, left column) and one low sensitivity group (find, a, γs, A, middle column). The right column shows the mean value of relative change in goodness of fit when all parameter values are subjected to simultaneous random variation 100 times within ranges of 1%, 5% and 10% of the original value.
Discussion
Due to the paucity of relevant experimental data the model is intentionally very simple. Despite this it is capable of making quite strong predictions concerning the relationship between observed temporal development of melanin production and distribution following UV-exposure and the thicknesses of the epidermal layers as well as the degree of dendricity.
The resolution level of the model is a trade-off between the benefits and disadvantages of simple models compared to complex models containing a large amount of molecular detail. In this work we do not explicitly model different signal substances, different receptors (and their genetic variants or their refractory periods), different second messengers and all the actors in the different pathways leading to melanogenesis and dendrification as well as the biochemical regulatory effects of melanin. This does not mean that the model is in conflict with the available information concerning these processes. Given more spatiotemporal experimental data on the tanning response as suggested by the current work, we think the stage will be set for the making of more high-resolution models.
In the six individuals which the model successfully describes, the model fails to achieve parameter determinability due to the wide range of parameter values that are able to provide a fit to data that is almost as good as the best (illustrated in Figure 3). To overcome the poor parameter determinability more data points are needed, given that the model is structurally identifiable. Ideally, future experiments should be designed through collaboration between theoreticians and experimentalists, e.g. by following the rules of identifiability analysis [44, 45] to ensure that modellers have maximal use of the data by optimizing the reliability of parameter estimates.
Tadokoro et al. [42] provide measurements of three additional individuals for which the model is not capable of achieving consistency with the empirical data. The reason for this is that the melanin levels in the granulosum or spinosum layers in these three individuals are lower 7 days after than before UV-exposure, and the model does not include mechanisms that can produce such behaviour. A possible explanation can be that the UV-exposure causes alteration of the thicknesses of the epidermal layers. A thinner spinosum or granulosum 7 days after UV radiation can, even with a higher relative melanin density, result in a decrease in measured melanin levels with the methods applied by Tadokoro et al. [42]. It should be stressed that such a mechanism can easily be implemented so that the model can account for all 9 individuals, but no insight is gained by this exercise before more empirical data become available. In fact, the above discrepancy between model results and empirical data clearly documents the need for including specific measurements of the thickness of epidermal layers in experimental set ups like that of Tadokoro et al. [42].
The model does not take into account the possibility that DNA damage due to UV-exposure causes the production of signals stimulating melanogenesis long after the cessation of UV-exposure (reviewed in [46]). Neither does it take into account that the thickness of stratum corneum may change with UV-exposure [47] and that this may influence the UV absorbance [11]. Since, so far, the data on how DNA damage might enhance and prolong signal substance production is so scarce, we find it premature to include this effect in our model. Moreover, the time window of UV radiation in the experiments used to validate our model is probably not long enough for the thickening of stratum corneum to take place and give an effect. Thus, we do not have data to assess whether or not the UV-induced thickening of stratum corneum plays an important role in the tanning process. This does not mean that the above phenomena are not interesting, but that, in the lack of quantitative data, not much would be gained by including them in the model.
Conclusion
We have translated the available knowledge of the constitutive melanin production and distribution as well as the tanning process in human skin into a differential equations model. The model provides a first generation theoretical framework for a quantitative understanding of the factors underlying observed phenotypic variation in skin colour and tanning ability. In six out of nine individuals for which empirical data exist, the model describes the tanning dynamics and identifies the thickness of the epidermal layers and the degree of dendrification as potentially important sources of variation. The model fails to describe the tanning dynamics in the last three individuals, but by doing so it identifies which data are needed for making an empirically validated improvement of the model to also handle these cases.
Methods
The aim of the model is to describe the temporal distribution of melanin in the epidermal layers following an UV pulse. Whenever b, s, g or c is used as subscripts below, they refer to the epidermal layers stratum basale, stratum spinosum, stratum granulosum, and stratum corneum, respectively. See Table 3 for an overview of parameters and their dimensions.
UV intensity and signal substance dynamics
The spatial intensity of the UV pulse is assumed to decrease exponentially with depth and absorbance down through the epidermis. As increased melanin content enhances UV absorption, the net signal substance production rate relative to baseline conditions as a function of UV intensity I and melanin content M may be expressed as:
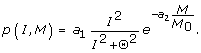
We assume that there is a maximal production rate a1 and that the actual production is a sigmoidal function of I with threshold parameter Θ (i.e. the production rate is half of its maximum when I equals Θ). In the exponential term, M0 is the constitutive melanin level and M is the current total melanin level in all layers;  . In the simulations, since the melanin amount in the epidermis does not change significantly during the first hour, and the model is exposed to UV radiation only during this period, the exponential term can be regarded as a constant. Furthermore, the UV intensity is assumed constant during the one hour of exposure and therefore the fraction term can be regarded as a constant as well. In the simulations the production rate can thus be regarded to be constant:
  .
.
The concentration of free signal substance is determined by the balance between its production and degradation, described by
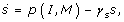
where we assume linear degradation with relative rate γ
s
and that the pulse of signal substance production (with magnitude  ) endures for only one hour, i.e. the ODE to be solved is
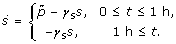
The analytical solution of equation (3) is

Let R stand for the fractional occupancy of melanocyte receptors binding signal substance. Then the rate of change of R is given by k+s(1-R) - k _R, where k+s and k _ are coupling and decoupling relative rates, respectively. We assume that an equilibrium between binding and release of signal molecules from the melanocyte surface is set up so fast relative to the time scale of the model that the rate of change can be set equal to zero, giving R in terms of signal substance concentration, i.e.

where K = k _/k+. Thus,

where

.
Melanin production
Melanocytes have a constitutive melanin production as well as the ability to increase melanin production as a response to receptor mediated signals. The melanin synthesis rate can thus be expressed as

In the absence of UV radiation the net signal substance level (not including base line levels) and hence the net fractional occupancy, R, is zero, such that fmin expresses the constitutive melanin production.
Dynamics of dendrite length
We assume that all the melanin is delivered to nearby keratinocytes. The melanin delivered to one particular layer is described as the production f(R) times a function d j for each layer j, where the d j 's are functions of the dendrite length relative to the maximum dendrite length, here denoted x. The dendrites grow when the melanocyte is stimulated by signal substances [5, 33]. We therefore assume that x is governed by

where the parameter a is the time constant of dendrite growth and retraction. Assuming that the dendrite is of zero extension initially, equation (8) can be analytically solved to give

Distribution of melanin as function of dendrite length
Assume a sphere with the melanocyte in the middle and radius equal to the dendrite length x (Figure 4a). The proportion of this sphere that resides in each layer of the epidermis is equated with the proportion of melanin delivered to this layer. As the radius of the sphere grows, the proportion of the volume residing in each layer changes. We use these proportions as guidelines for distributing the melanin produced. The proportion functions below (10) derived from the formula for volume of a sphere and the thickness of the different layers are plotted in Figure 4b. We define all dendrite tips to be in the basal layer provided that the relative dendrite length x is below h bs , where hbs = 1/2Tb/(1/2Tb + Ts + Tg) (T j denotes thickness of layer j) is the distance from the centre of the melanocyte to the border between stratum basale and stratum spinosum relative to the maximal dendrite length which equals 1/2Tb + Ts + Tg. The dendrite tips extend to the spinosum layer when hbs ≤ x ≤ hsg and to the granulosum layer when x > hsg, where hsg = hbs + Ts/(1/2Tb + Ts + Tg) is the distance from the centre of the melanocyte to the border between stratum spinosum and stratum granulosum relative to 1/2Tb + Ts + Tg. We then obtain the functions d j , j = b, s, g, describing the melanin delivery distributions,

Melanin distribution ratios between the different layers as a function of the dendrite length. As the length of the dendrite, x, grows, the ratio of reached volume in each layer changes (a). In b) these ratios are plotted versus the dendrite length. With short dendrites (x1) all melanin is delivered to the basal layer. As the dendrite is growing, more is delivered to stratum spinosum (x2), and when they are long enough they also distribute melanin to the stratum granulosum (x3).

It should be noted that dg(x) + ds(x) + db(x) = 1 holds for all x.
Melanin dynamics within keratinocytes
The data obtained by Tadokoro et al. [42] are given in an absolute but not scaled unit of the amount of melanin in each layer. Using the same unit, we model the melanin content in each layer by the following set of differential equations, where M j denotes melanin content in layer j,

where the terms d j (x)f(R), j = b, s, g, represent melanin delivery rates from melanocytic dendrites into keratinocytes of layer j and ω j = w/V j , j = b, s, g, c (w and V j are described below). We assume that melanin has a relative degradation rate γM (with unit h-1) and that w (unit: cell h-1) describes the speed by which keratinocytes move towards the surface. The scope of this model is the melanin unit (defined in Background and not to be confused with a unit of measurement) which we assume to have the same area throughout the epidermis (described by the parameter area). The volume of each layer is then V j = T j × area.
With the above definition of ω j , j = b, s, g, the quantities hbs and hsg can be defined in terms of the model parameters as follows;

The sum of the inverses of the ω j 's, j = b, s, g, equals (Tb/2 + Ts + Tg) × area/w, which is approximately 400 (Table 3). Thus, if ωb and ωg are given, ωs follows by a simple calculation.
Estimates of parameter ranges
The parameters of the model and their values are presented in Table 3. In the following we describe the derivations of parameter value ranges.
Volume of the layers, V
The volume of each layer is given as the number of cells in one melanin unit. In the simulations we have divided the volume into thickness T j , j = c, g, s, b and area. In this model the melanin unit has a fixed area throughout the epidermis, hence only the thickness varies between the layers. The layer thicknesses, presented in Table 3, are obtained from [40]. The melanocyte density, and thus the area of one melanin unit, does not vary between different skin colours but it does vary with body location [40]. Melanocyte density is measured in different ways, but from [40, 42, 48] we have derived an average of the area of the melanin unit on the actual body site (lower back) to be 4–6 cells.
Cell movement, w
The parameter w (with unit cell per hr) describes the movement of keratinocytes upwards from layer to layer. The epidermal turnover time tturnover, the time from a cell is born in the basal layer until it is shred off the corneum layer, is 52 – 75 days in normal skin [40]. The parameter w can then be estimated from the relation

where T is the total thickness of all four layers.
Parameter estimation using a maximum-likelihood approach
The model parameters were fitted to data provided by [42] which describe the melanin amount in the three lowest layers of epidermis before and 7 days after UV irradiation in nine individuals. We denote the 9 individual data sets according to the codes used by Tadokoro et al. [42, 43].
Analytical solution formulas for the variables in equation (11) are obtained by solving the equation for Mb given x(t) and R(t), then solving the equation for Ms given Mb(t) and, finally, using Ms(t) to solve the equation for Mg(t). We thus obtain the solution formulas

We note that for Mb there is an accumulation of melanin due to delivery (db) whereas for Ms and Mg in addition to the delivery term there is a term due to the outwardly directed melanin transport.
By setting the derivatives equal to zero we find expressions for the steady state values of the variables of the model. Under baseline conditions the melanin production is at its minimum and the dendricity is zero. Hence the melanin contents are simply determined by setting the derivatives in equation (11) equal to zero and setting d g (x) = 0, d s (x) = 0, d b (x) = 1, and f(R) = f(0) = fmin. Then

In the same manner as above Mc can be found, but we omit the calculation of the corresponding solution formula as this variable is not needed in the parameter estimation.
In order to obtain robust parameter estimates, we used a maximum likelihood approach where one seeks to maximize the so-called likelihood function (the probability density of a model for the occurrence of the measurements given a set of parameters). Assuming the probability of the measurements to be uncorrelated normal distributions, the log-likelihood function is

where N is the number of measurements  with variance
  and M
k
(p) is the model prediction given the vector of parameters p. If we assume the measurement noise to be Gaussian with variance that is proportional to the magnitude of the measurement with proportionality f (which is reasonable since Tadekoro et al. count pixels in a picture), minimizing the log-likelihood function is equivalent to least squares minimization of the quantity
and M
k
(p) is the model prediction given the vector of parameters p. If we assume the measurement noise to be Gaussian with variance that is proportional to the magnitude of the measurement with proportionality f (which is reasonable since Tadekoro et al. count pixels in a picture), minimizing the log-likelihood function is equivalent to least squares minimization of the quantity

with respect to the parameters p. Note that f is unknown since we do not have information on the statistics of the pixel counting process. Thus, in terms of our model and data we should minimize

where  and
and  , j = b, s, g, are the melanin data in the basal, spinosum and granulosum layers at 0 and 7 days, respectively,

and

are the model predictions at 0 and 7 days, given in equations (15) and (14) respectively, as function of the parameter vector p which is defined as

With the exception of fmin, we enforce constraints on all the parameters;

The constraints on ωg and ωb are due to empirical data (calculated from Table 3).
The remaining constraints were chosen to ensure that the model predicts an effect of the UV pulse. For example, without the constraint γs > 0 the minimization routine frequently suggested that γs is zero in the proposed minimum. In consequence, the fractional occupancy of melanocyte receptor is constant, meaning that melanin synthesis beyond the baseline level is not induced.
In the minimization algorithm the function x(t) and the functions M j (t), j = b, s, g, evaluated in t = 7 × 24 h, are computed using the trapezoid method with Δt = 1 for numerical computation of the integrals in equations (15) and (14), respectively. The constrained minimization routine fmincon (Mathworks Inc.) using an active-set algorithm is applied to determine the parameter values that give the best fit of the model to empirical data.
Practical identifiability
With the present model and data we have more unknowns than observations, i.e. a negative number of degrees of freedom. This makes it impossible to perform a rigorous statistical treatment of the model goodness-of-fit and of the parameter significance, which would otherwise be a natural part of practical identifiability analysis. We therefore focus our analysis on parameter determinability.
The simplest way of assessing parameter determinability is by computing the cross-correlation between the different parameters [44]. The cross-correlation between parameters i and j is

where V
ij
are the entries of the estimated parameter covariance matrix  (defined below). A large correlation between two parameter estimates (close to -1 or 1) indicates that the two parameters are weakly determinable because of their large influence on each other. We will require that

for parameter i to be considered determinable.
Taking the second partial derivatives of the log-likelihood function L with respect to the parameter vector p shows that the information matrix is closely related to the Hessian of F

From this an estimate of the parameter error covariance matrix can be obtained;

For each individual which the model successfully describes, the Hessian of F evaluated in the minimum is computed, giving the estimated parameter covariance matrix from which the parameter cross-correlations are obtained using equation (21) (given in additional file 1: Doc1). In individual S26 all parameters show correlations at 1 or -1 (due to the information matrix being very close to singular) indicating that none of the parameters are determinable. In the remaining individuals, some, but not all, parameters are determinable (Table 2 and additional file 1: Doc1).
Using the Cramer-Rao bound for multivariate data for the i'th parameter (as before, IM denotes the information matrix and (IM-1) ii denotes the i'th diagonal element of its inverse),

we can use the diagonal elements of the parameter covariance matrix to produce the confidence interval for parameter i;

The quantity  is proportional to the unknown factor f. In order for the estimated confidence intervals not to include zero, f must be sufficiently small. In Additional file 1: Doc1 are listed all estimated parameter confidence intervals expressed in terms of f for all individuals that the model is able to describe and the corresponding inequality that f must satisfy in order that the confidence interval does not include zero. We observe that in four of the individuals (S47, S35, S37 and S26) f must be unrealistically small (of order 10-4 or less) and in two individuals (S19 and S21) the constraints are much less strict (of order 10-2) for the confidence intervals to not include zero. Interestingly, individuals S19 and S21 exhibit the most consistent confidence intervals as well as the largest number of determinable parameters (Table 2).
References
Jablonski NG: The evolution of human skin and skin color. Annual Review of Anthropology. 2004, 33: 585-623. 10.1146/annurev.anthro.33.070203.143955.
Rigel DS: Cutaneous ultraviolet exposure and its relationship to the development of skin cancer. J Am Acad Dermatol. 2008, 58: S129-132. 10.1016/j.jaad.2007.04.034
Steingrimsson E, Copeland NG, Jenkins NA: Melanocytes and the microphthalmia transcription factor network. Annu Rev Genet. 2004, 38: 365-411. 10.1146/annurev.genet.38.072902.092717
Lin JY, Fisher DE: Melanocyte biology and skin pigmentation. Nature. 2007, 445: 843-850. 10.1038/nature05660
Slominski A, Tobin DJ, Shibahara S, Wortsman J: Melanin pigmentation in mammalian skin and its hormonal regulation. Physiol Rev. 2004, 84: 1155-1228. 10.1152/physrev.00044.2003
Slominski A, Pawelek J: Animals under the sun: effects of ultraviolet radiation on mammalian skin. Clin Dermatol. 1998, 16: 503-515. 10.1016/S0738-081X(98)00023-6
Dorr RT, Ertl G, Levine N, Brooks C, Bangert JL, Powell MB, Humphrey S, Alberts DS: Effects of a superpotent melanotropic peptide in combination with solar UV radiation on tanning of the skin in human volunteers. Arch Dermatol. 2004, 140: 827-835. 10.1001/archderm.140.7.827
Slominski A, Paus R: Towards defining receptors for L-tyrosine and L-dopa. Mol Cell Endocrinol. 1994, 99: C7-11. 10.1016/0303-7207(94)90001-9
Slominski A, Paus R, Schadendorf D: Melanocytes as "sensory" and regulatory cells in the epidermis. J Theor Biol. 1993, 164: 103-120. 10.1006/jtbi.1993.1142
Slominski A, Paus R: Are L-tyrosine and L-dopa hormone-like bioregulators?. J Theor Biol. 1990, 143: 123-138. 10.1016/S0022-5193(05)80292-9
Nielsen KP, Lu Z, Juzenas P, Stamnes JJ, Stamnes K, Moan J: Reflectance spectra of pigmented and nonpigmented skin in the UV spectral region. Photochem Photobiol. 2004, 80: 450-455.
Sturm RA: Human pigmentation genes and their response to solar UV radiation. Mutat Res. 1998, 422: 69-76.
Costin GE, Hearing VJ: Human skin pigmentation: melanocytes modulate skin color in response to stress. Faseb J. 2007, 21: 976-994. 10.1096/fj.06-6649rev
Hoogduijn MJ, Ancans J, Suzuki I, Estdale S, Thody AJ: Melanin-concentrating hormone and its receptor are expressed and functional in human skin. Biochem Biophys Res Commun. 2002, 296: 698-701. 10.1016/S0006-291X(02)00932-4
Slominski A, Roloff B, Curry J, Dahiya M, Szczesniewski A, Wortsman J: The skin produces urocortin. J Clin Endocrinol Metab. 2000, 85: 815-823. 10.1210/jc.85.2.815
Slominski A, Wortsman J: Neuroendocrinology of the skin. Endocr Rev. 2000, 21: 457-487. 10.1210/er.21.5.457
Slominski A, Wortsman J, Luger T, Paus R, Solomon S: Corticotropin releasing hormone and proopiomelanocortin involvement in the cutaneous response to stress. Physiol Rev. 2000, 80: 979-1020.
Abdel-Malek ZA, Knittel J, Kadekaro AL, Swope VB, Starner R: The melanocortin 1 receptor and the UV response of human melanocytes – a shift in paradigm. Photochem Photobiol. 2008, 84: 501-508. 10.1111/j.1751-1097.2008.00294.x
Chakraborty AK, Funasaka Y, Slominski A, Ermak G, Hwang J, Pawelek JM, Ichihashi M: Production and release of proopiomelanocortin (POMC) derived peptides by human melanocytes and keratinocytes in culture: regulation by ultraviolet B. Biochim Biophys Acta. 1996, 1313: 130-138. 10.1016/0167-4889(96)00063-8
Im S, Moro O, Peng F, Medrano EE, Cornelius J, Babcock G, Nordlund JJ, Abdel-Malek ZA: Activation of the cyclic AMP pathway by alpha-melanotropin mediates the response of human melanocytes to ultraviolet B radiation. Cancer Res. 1998, 58: 47-54.
Cui R, Widlund HR, Feige E, Lin JY, Wilensky DL, Igras VE, D'Orazio J, Fung CY, Schanbacher CF, Granter SR, Fisher DE: Central role of p53 in the suntan response and pathologic hyperpigmentation. Cell. 2007, 128: 853-864. 10.1016/j.cell.2006.12.045
Slominski A, Plonka PM, Pisarchik A, Smart JL, Tolle V, Wortsman J, Low MJ: Preservation of eumelanin hair pigmentation in proopiomelanocortin-deficient mice on a nonagouti (a/a) genetic background. Endocrinology. 2005, 146: 1245-1253. 10.1210/en.2004-0733
Smart JL, Low MJ: Lack of proopiomelanocortin peptides results in obesity and defective adrenal function but normal melanocyte pigmentation in the murine C57BL/6 genetic background. Ann N Y Acad Sci. 2003, 994: 202-210. 10.1111/j.1749-6632.2003.tb03181.x
Rana BK, Hewett-Emmett D, Jin L, Chang BH, Sambuughin N, Lin M, Watkins S, Bamshad M, Jorde LB, Ramsay M, et al.: High polymorphism at the human melanocortin 1 receptor locus. Genetics. 1999, 151: 1547-1557.
Rouzaud F, Costin GE, Yamaguchi Y, Valencia JC, Berens WF, Chen KG, Hoashi T, Bohm M, Abdel-Malek ZA, Hearing VJ: Regulation of constitutive and UVR-induced skin pigmentation by melanocortin 1 receptor isoforms. Faseb J. 2006, 20: 1927-1929. 10.1096/fj.06-5922fje
Tachibana M: MITF: a stream flowing for pigment cells. Pigment Cell Res. 2000, 13: 230-240. 10.1034/j.1600-0749.2000.130404.x
Jacquemin P, Lannoy VJ, O'Sullivan J, Read A, Lemaigre FP, Rousseau GG: The transcription factor onecut-2 controls the microphthalmia-associated transcription factor gene. Biochem Biophys Res Commun. 2001, 285: 1200-1205. 10.1006/bbrc.2001.5294
Bellei B, Flori E, Izzo E, Maresca V, Picardo M: GSK3beta inhibition promotes melanogenesis in mouse B16 melanoma cells and normal human melanocytes. Cell Signal. 2008, 20: 1750-1761. 10.1016/j.cellsig.2008.06.001
Miller AJ, Mihm MC: Melanoma. N Engl J Med. 2006, 355: 51-65. 10.1056/NEJMra052166
Shibahara S, Takeda K, Yasumoto K, Udono T, Watanabe K, Saito H, Takahashi K: Microphthalmia-associated transcription factor (MITF): multiplicity in structure, function, and regulation. J Investig Dermatol Symp Proc. 2001, 6: 99-104. 10.1046/j.0022-202x.2001.00010.x
Galibert MD, Carreira S, Goding CR: The Usf-1 transcription factor is a novel target for the stress-responsive p38 kinase and mediates UV-induced Tyrosinase expression. Embo J. 2001, 20: 5022-5031. 10.1093/emboj/20.17.5022
Saha B, Singh SK, Sarkar C, Bera R, Ratha J, Tobin DJ, Bhadra R: Activation of the Mitf promoter by lipid-stimulated activation of p38-stress signalling to CREB. Pigment Cell Res. 2006, 19: 595-605. 10.1111/j.1600-0749.2006.00348.x
Busca R, Ballotti R: Cyclic AMP a Key Messenger in the Regulation of Skin Pigmentation. Pigment Cell Research. 2000, 13: 60-69. 10.1034/j.1600-0749.2000.130203.x
Huber WE, Price ER, Widlund HR, Du J, Davis IJ, Wegner M, Fisher DE: A tissue-restricted cAMP transcriptional response: SOX10 modulates alpha-melanocyte-stimulating hormone-triggered expression of microphthalmia-associated transcription factor in melanocytes. J Biol Chem. 2003, 278: 45224-45230. 10.1074/jbc.M309036200
Hara M, Yaar M, Gilchrest BA: Endothelin-1 of keratinocyte origin is a mediator of melanocyte dendricity. J Invest Dermatol. 1995, 105: 744-748. 10.1111/1523-1747.ep12325522
Romero-Graillet C, Aberdam E, Clement M, Ortonne JP, Ballotti R: Nitric oxide produced by ultraviolet-irradiated keratinocytes stimulates melanogenesis. J Clin Invest. 1997, 99: 635-642. 10.1172/JCI119206
Seiberg M: Keratinocyte-Melanocyte Interactions During Melanosome Transfer. Pigment Cell Research. 2001, 14: 236-242. 10.1034/j.1600-0749.2001.140402.x
Yoshida Y, Hachiya A, Sriwiriyanont P, Ohuchi A, Kitahara T, Takema Y, Visscher MO, Boissy RE: Functional analysis of keratinocytes in skin color using a human skin substitute model composed of cells derived from different skin pigmentation types. Faseb J. 2007, 21: 2829-2839. 10.1096/fj.06-6845com
Hearing VJ: Regulating melanosome transfer: who's driving the bus?. Pigment Cell Res. 2007, 20: 334-335.
Burns TF, Rook A: Rook's textbook of dermatology. Edited by: Tony Burns, et al. 2004, Malden, Mass.; Oxford: Blackwell Science, 7
Sandby-Moller J, Poulsen T, Wulf HC: Epidermal thickness at different body sites: relationship to age, gender, pigmentation, blood content, skin type and smoking habits. Acta Derm Venereol. 2003, 83: 410-413. 10.1080/00015550310015419
Tadokoro T, Yamaguchi Y, Batzer J, Coelho SG, Zmudzka BZ, Miller SA, Wolber R, Beer JZ, Hearing VJ: Mechanisms of skin tanning in different racial/ethnic groups in response to ultraviolet radiation. J Invest Dermatol. 2005, 124: 1326-1332. 10.1111/j.0022-202X.2005.23760.x
Tadokoro T, Kobayashi N, Zmudzka BZ, Ito S, Wakamatsu K, Yamaguchi Y, Korossy KS, Miller SA, Beer JZ, Hearing VJ: UV-induced DNA damage and melanin content in human skin differing in racial/ethnic origin. Faseb J. 2003, 17: 1177-1179.
Jaqaman K, Danuser G: Linking data to models: data regression. Nat Rev Mol Cell Biol. 2006, 7: 813-819. 10.1038/nrm2030
Gadkar KG, Gunawan R, Doyle FJ: Iterative approach to model identification of biological networks. BMC Bioinformatics. 2005, 6: 155- 10.1186/1471-2105-6-155
Agar N, Young AR: Melanogenesis: a photoprotective response to DNA damage?. Mutat Res. 2005, 571: 121-132.
Wulf HC, Sandby-Moller J, Kobayasi T, Gniadecki R: Skin aging and natural photoprotection. Micron. 2004, 35: 185-191. 10.1016/j.micron.2003.11.005
Whiteman DC, Parsons PG, Green AC: Determinants of melanocyte density in adult human skin. Arch Dermatol Res. 1999, 291: 511-516. 10.1007/s004030050446
Acknowledgements
We thank Timothy Lavelle for providing additional biological insight and help in manuscript preparation. We are grateful for three anonymous review reports which helped us to improve the manuscript considerably. The study was supported by the Research Council of Norway through its Functional Genomics Programme (FUGE).
Author information
Authors and Affiliations
Corresponding author
Additional information
Authors' contributions
SWO and EH conceived the study. JT carried out the model development, simulations and manuscript drafting. LØ participated in the model development and in the manuscript drafting. EH contributed in the parameterization of the model, provided biological understanding of the problem, and participated in the manuscript drafting. SWO participated in the study design and coordination and helped to draft the manuscript. All authors read and approved the final manuscript.
Electronic supplementary material
12918_2008_328_MOESM1_ESM.pdf
Additional file 1: Estimated parameter covariance matrices and confidence intervals. Matlab output of estimated parameter cross-correlation matrices (Vhat) and parameter confidence intervals (CI) expressed by the ratio of measurement noise to measurement magnitude for the individuals which the model explains. (PDF 28 KB)
Authors’ original submitted files for images
Below are the links to the authors’ original submitted files for images.
Rights and permissions
Open Access This article is published under license to BioMed Central Ltd. This is an Open Access article is distributed under the terms of the Creative Commons Attribution License ( https://creativecommons.org/licenses/by/2.0 ), which permits unrestricted use, distribution, and reproduction in any medium, provided the original work is properly cited.
About this article
Cite this article
Thingnes, J., Øyehaug, L., Hovig, E. et al. The mathematics of tanning. BMC Syst Biol 3, 60 (2009). https://doi.org/10.1186/1752-0509-3-60
Received:
Accepted:
Published:
DOI: https://doi.org/10.1186/1752-0509-3-60